5 FpVTE 2012—Class B
Results in this section involve variations of Identification Flat captures (i.e., right slap, left slap, and thumb slaps, otherwise known as finger positions 13–15 or a 4-4-2 configuration). Probes of right slap, left slap, right and left slap, and a complete Identification Flat were searched against an enrollment database of 3 000 000 subjects containing all ten fingers in an Identification Flat configuration.
The datasets in this section are equivalent to those used in NIST FpVTE 2012 (Class B). Detailed information about FpVTE 2012 can be found in NIST IR 8034.
Notes:
- No examiner extended feature set data was provided with the images.
- Slap segmentation, if required, was performed by
hisign+0015.
5.1 Template Generation
The approximate total number of records that underwent template generation along with a tally of records that failed to process are shown in Table 5.1. Each template was generated by a single function call providing hisign+0015 all of the listed image types.
| Image Contents | Template Type | Failure to Extract | ≈Total |
|---|---|---|---|
| Left Slap | Probe | 4 | 30 000 |
| Right Slap | 6 | 30 000 | |
| Left + Right Slap | 10 | 30 000 | |
| Identification Flats | 553 | 30 000 | |
| Reference | 46 068 | 3 000 000 |
5.2 Search
The probe templates from Table 5.1 were searched against an enrollment database of 3 000 000 subjects containing images as specified in the reference template row of Table 5.1. Approximately one-third of the probes had a corresponding mate in the enrollment database.
5.2.1 DET
The DET plot in Figure 5.1 show the tradeoff of errors of hisign+0015 when searching each probe set from FpVTE 2012—Class B against enrollment database of 3 000 000 subjects where, for approximately one-third of the probes, a single mated identity consisting of all ten fingers in an Identification Flat configuration was present. Tabular versions of FNIR at select FPIR can be viewed in Table 5.2.
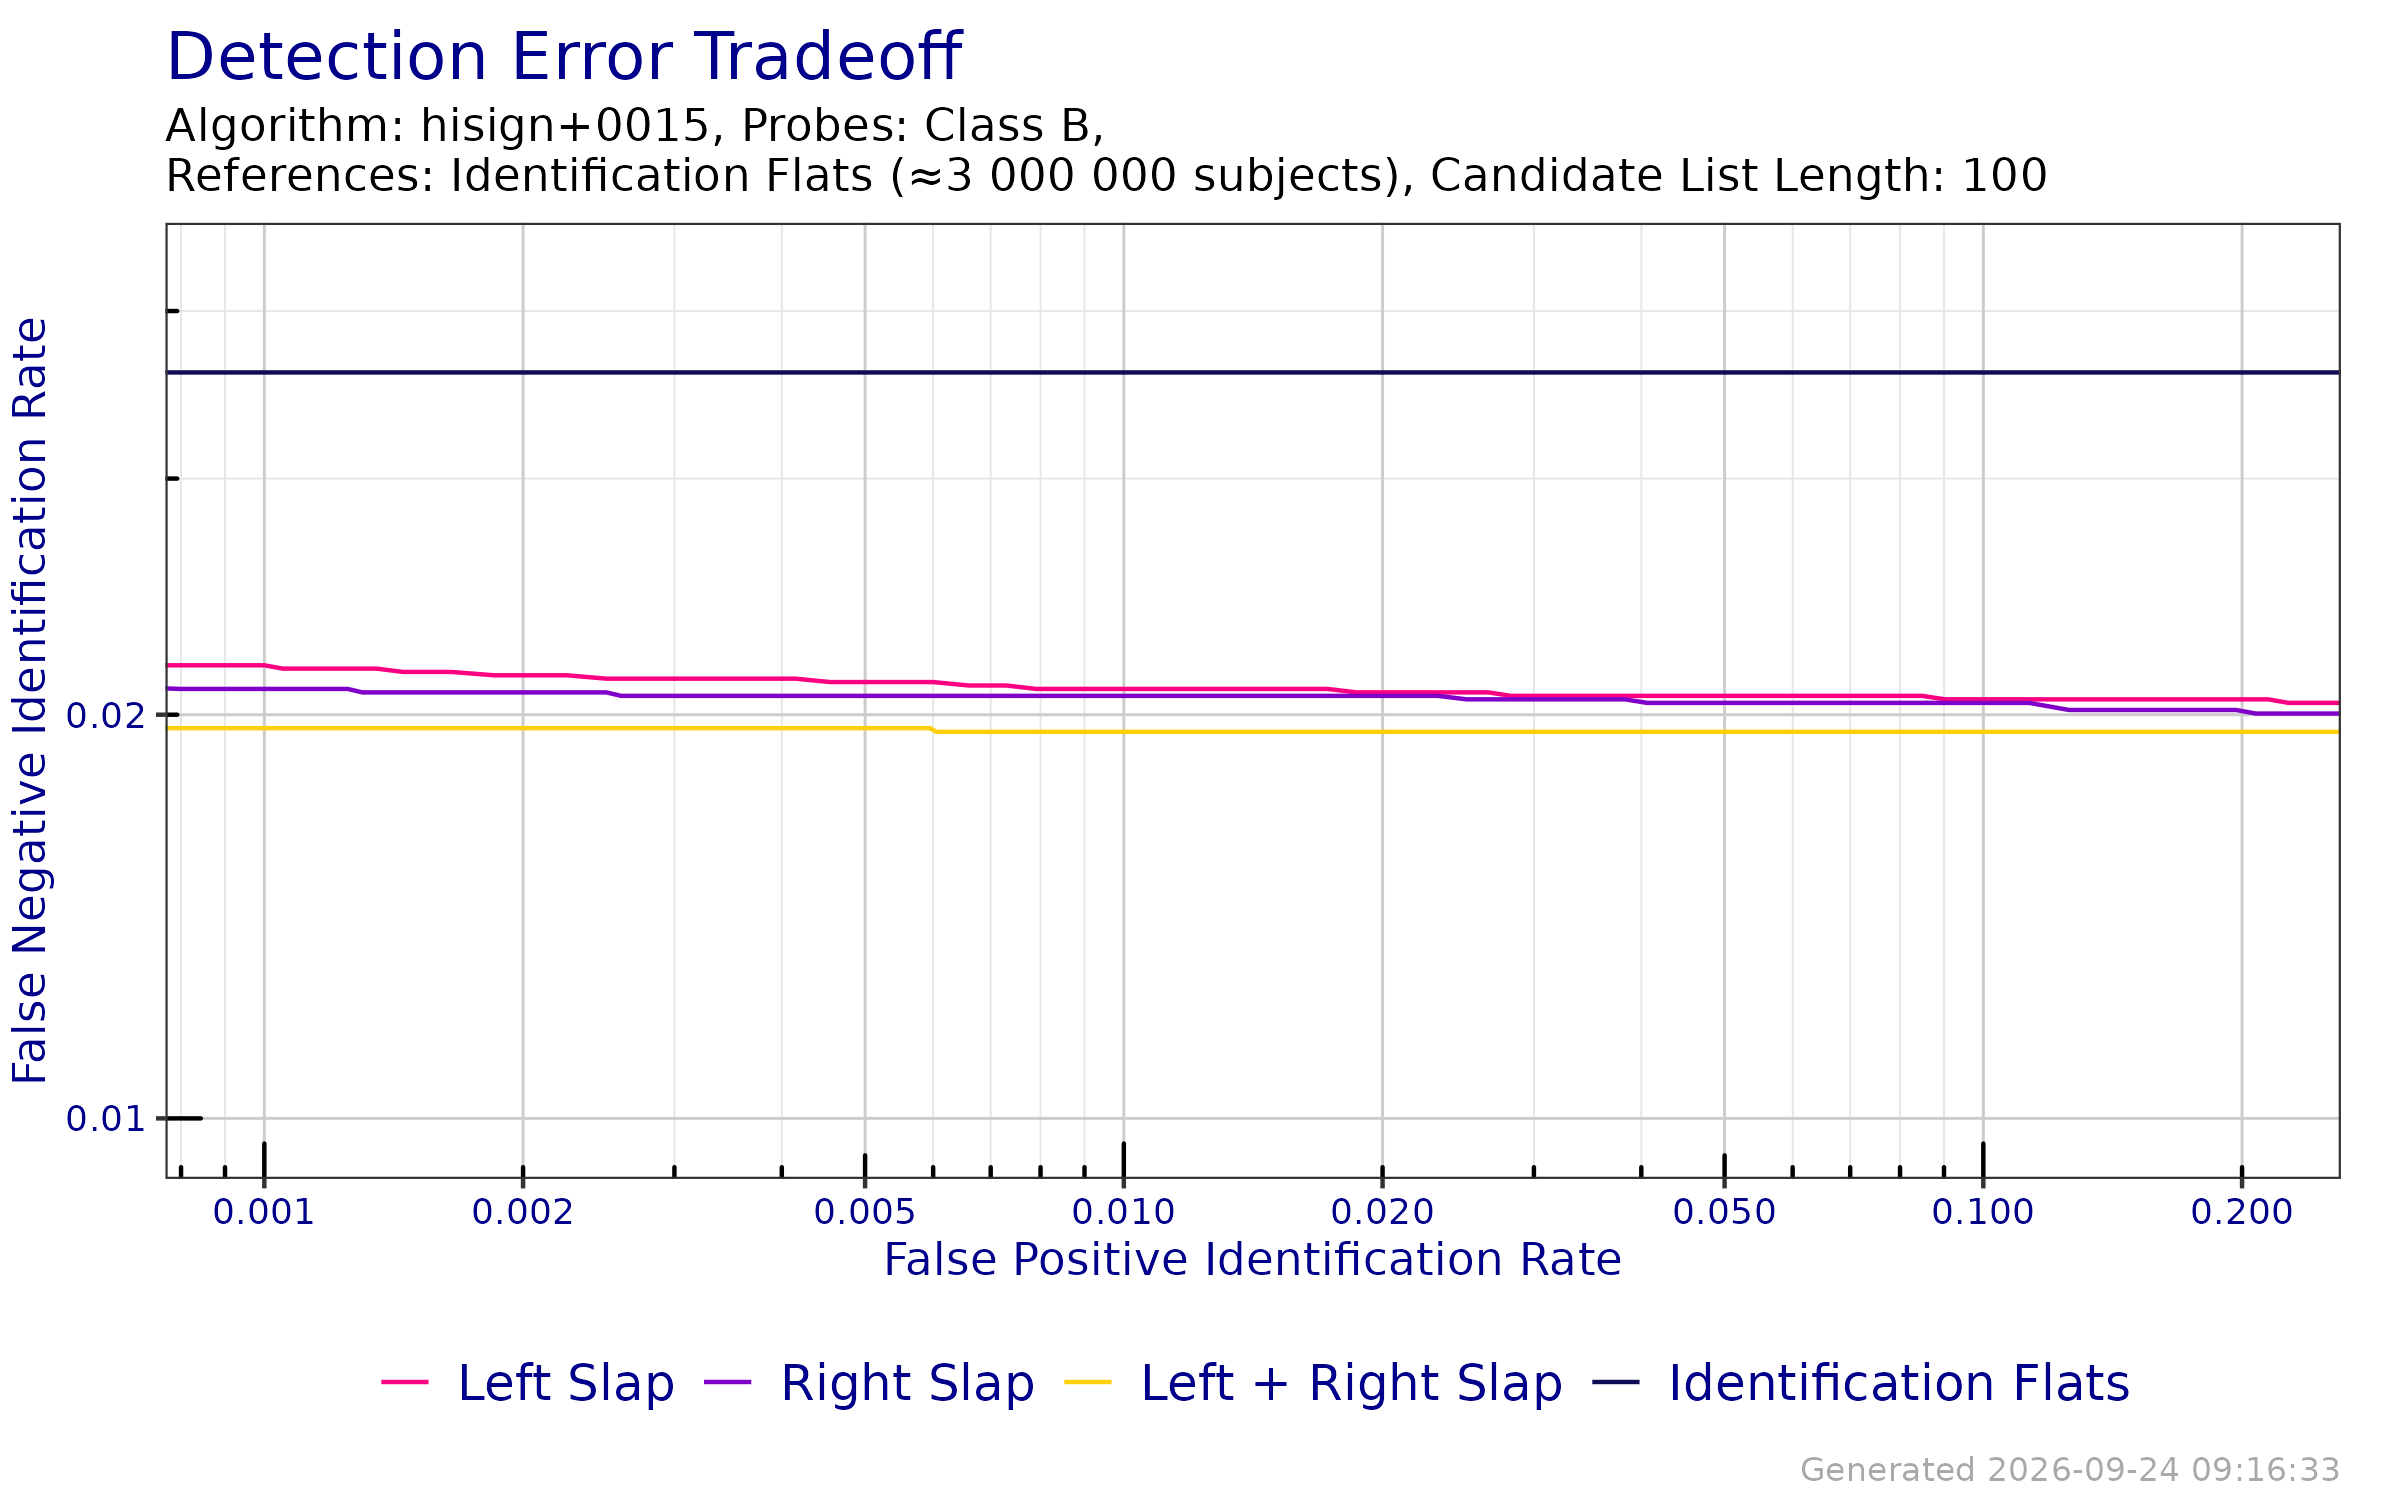
Figure 5.1: DET when searching probe templates from FpVTE 2012—Class B against an enrollment database of Identification Flats.
| Probe Content | FPIR ≤ 0.001 | FPIR ≤ 0.005 | FPIR ≤ 0.01 |
|---|---|---|---|
| Left Slap | 0.0218 | 0.0212 | 0.0209 |
| Right Slap | 0.0209 | 0.0207 | 0.0207 |
| Left + Right Slap | 0.0195 | 0.0195 | 0.0194 |
| Identification Flats | 0.0360 | 0.0360 | 0.0360 |
| Probe Content | FPIR ≤ 0.001 | FPIR ≤ 0.005 | FPIR ≤ 0.01 |
|---|---|---|---|
| Left Slap | 744.0 | 721.0 | 712.00 |
| Right Slap | 739.0 | 720.0 | 711.00 |
| Left + Right Slap | 829.5 | 800.5 | 784.00 |
| Identification Flats | 833.0 | 801.0 | 786.25 |
5.2.2 CMC
The CMC plot in Figure 5.2 show the FNIR of hisign+0015 when searching each probe set from FpVTE 2012—Class B against enrollment database of 3 000 000 subjects where, for approximately one-third of the probes, a single mated identity consisting of all ten fingers in an Identification Flat configuration was present. Tabular versions of FNIR at select ranks can be viewed in Table 5.4.
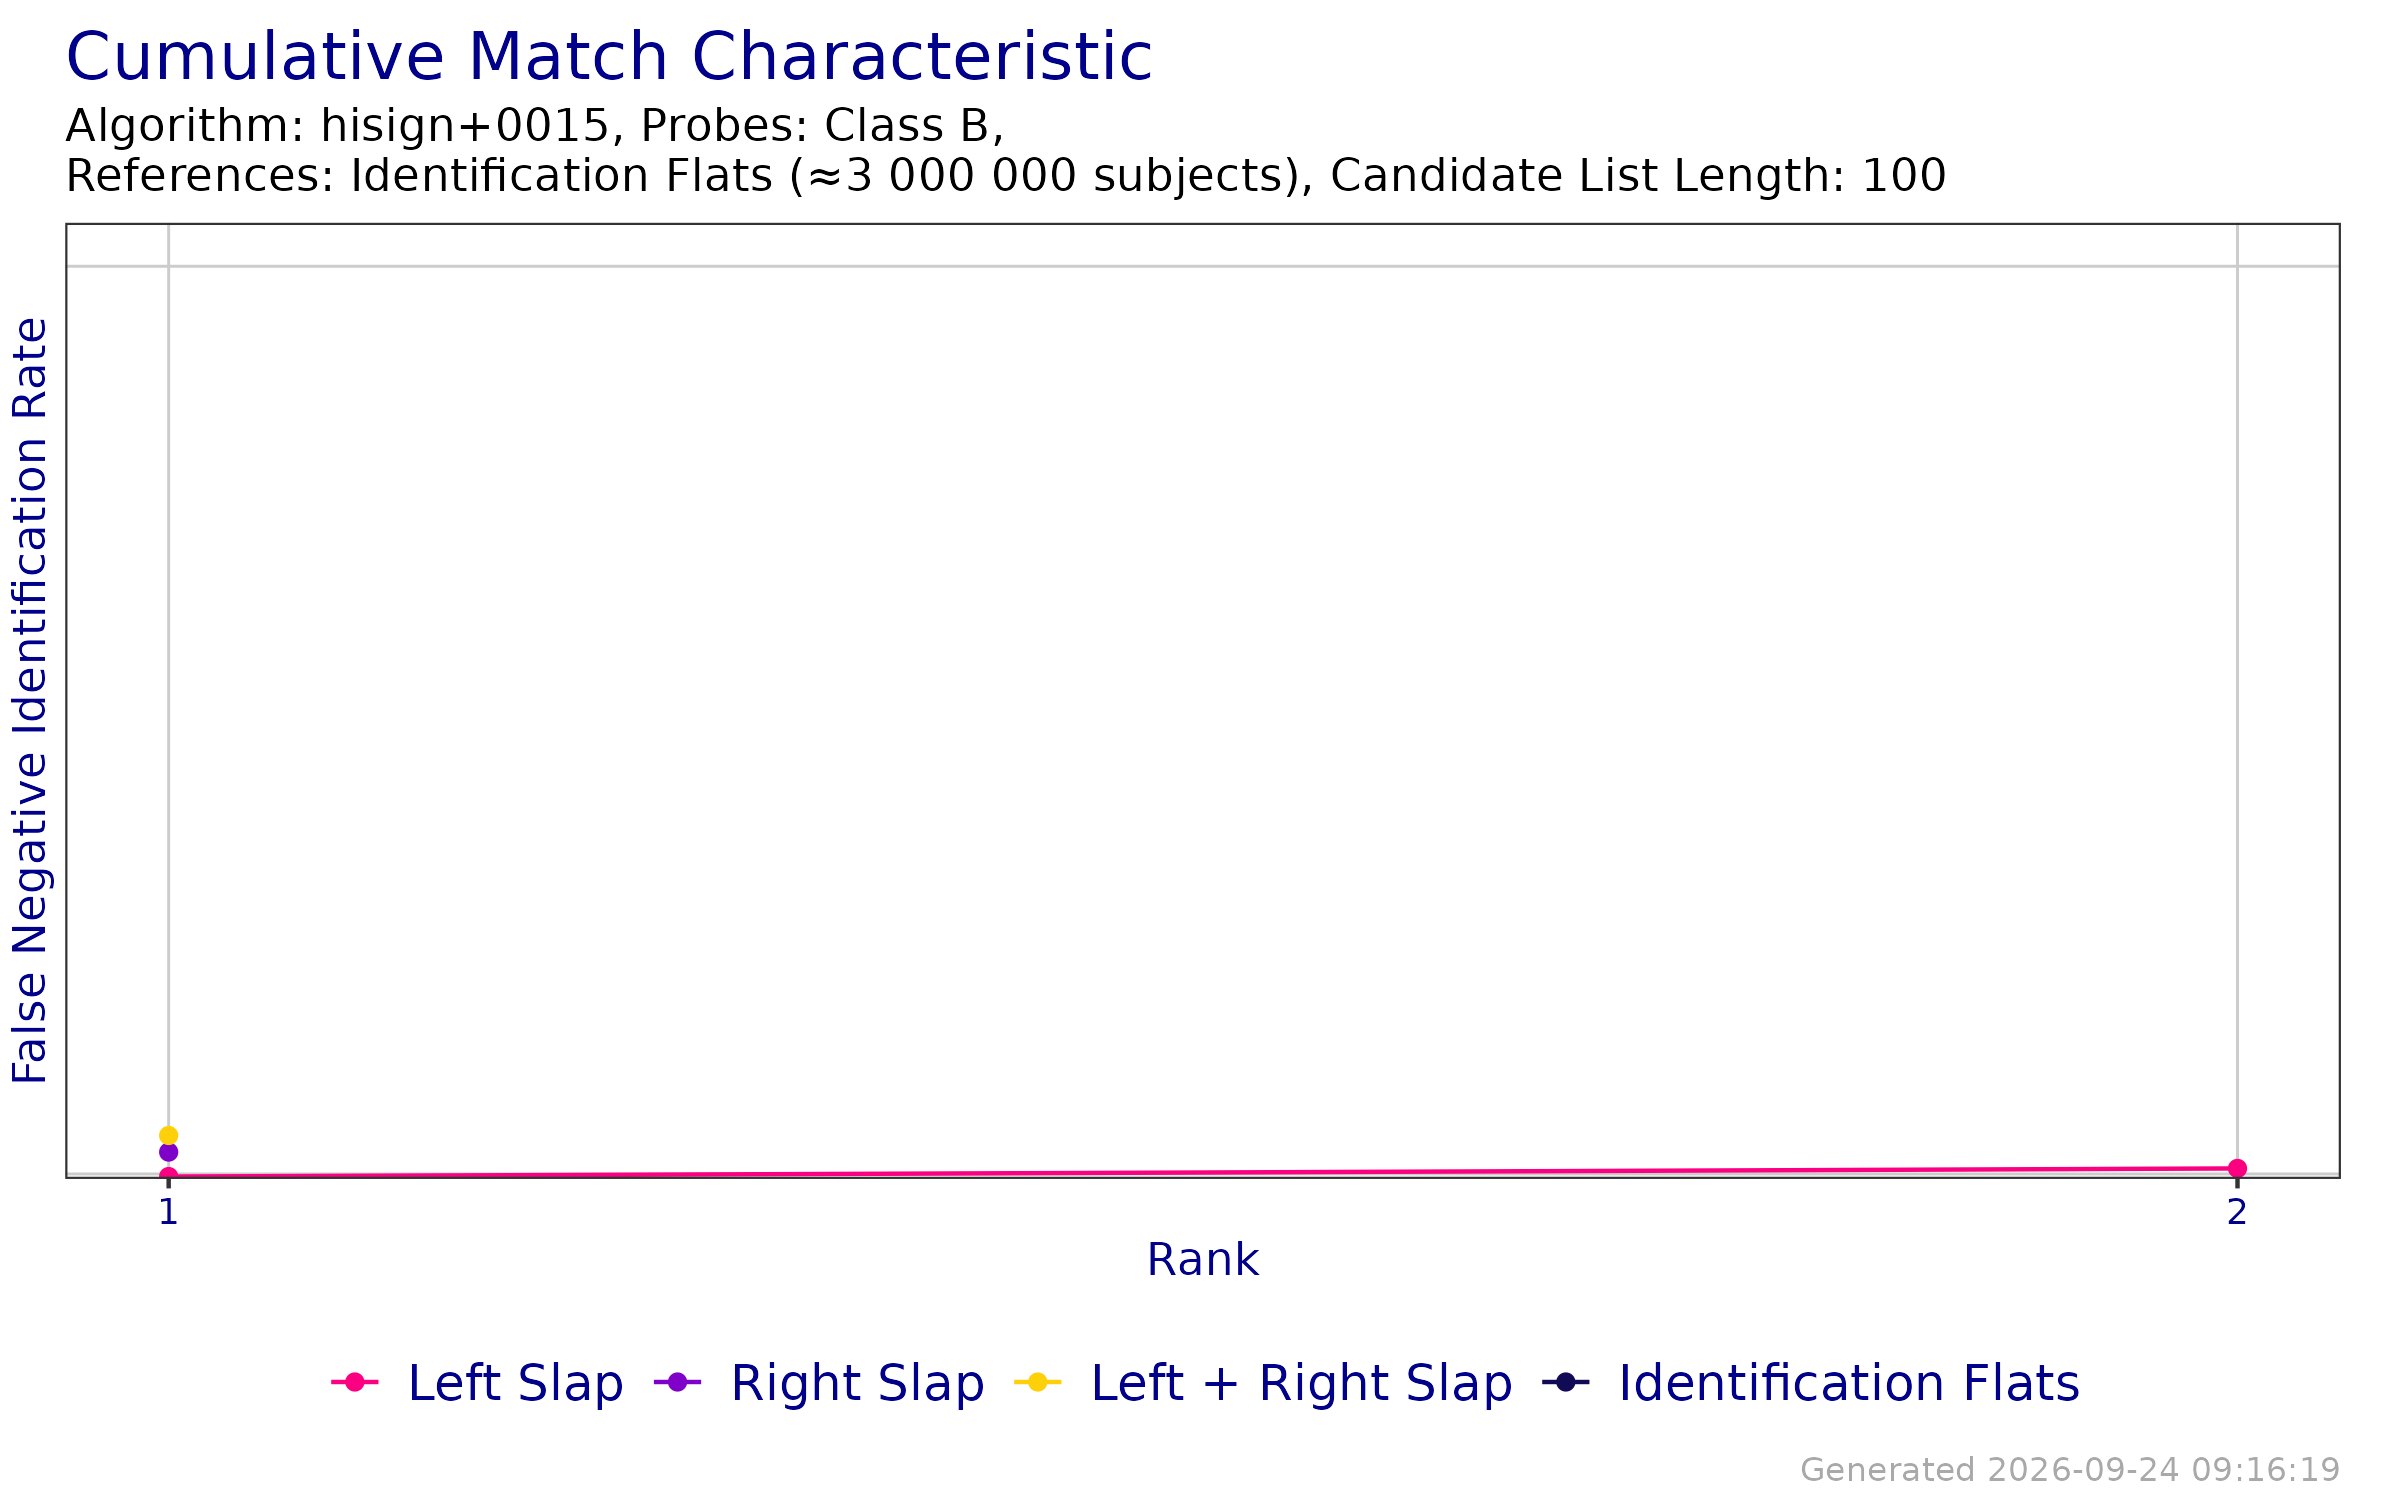
Figure 5.2: CMC when searching probe templates from FpVTE 2012—Class B against an enrollment database of Identification Flats.
| Probe Content | Rank 1 | Rank ≤ 2 | Rank ≤ 5 | Rank ≤ 10 | Rank ≤ 50 | Rank ≤ 100 |
|---|---|---|---|---|---|---|
| Left Slap | 0.0200 | 0.0199 | 0.0199 | 0.0199 | 0.0199 | 0.0199 |
| Right Slap | 0.0197 | 0.0197 | 0.0197 | 0.0197 | 0.0197 | 0.0197 |
| Left + Right Slap | 0.0194 | 0.0194 | 0.0194 | 0.0194 | 0.0194 | 0.0194 |
| Identification Flats | 0.0360 | 0.0360 | 0.0360 | 0.0360 | 0.0360 | 0.0360 |